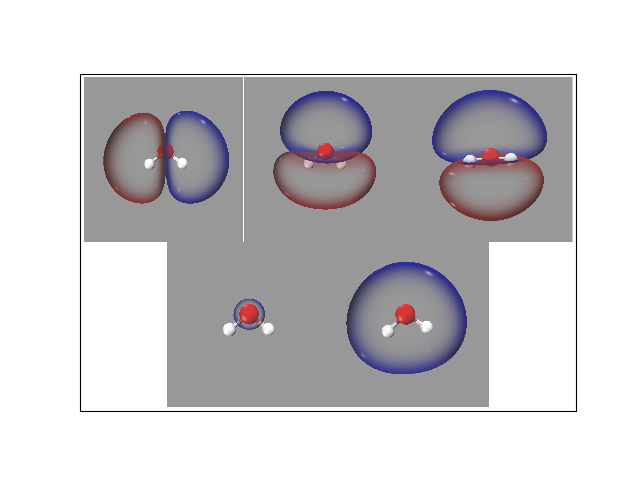
EX1: MO from wave-function file
Compute MO and visualize it for water.
from chemtools import MOTBasedTool

# 1. Build MO Theory model

mo = MOTBasedTool.from_file('h2o.fchk')

# 2. Generate cube file(s) and script(s) for visualizing all MO
#    Files generated are h2o_mo{index}.cube & h2o_mo{index}.vmd
#    To visualize the iso-surface, use command: $ vmd -e h2o_mo{index}.vmd

mo.generate_scripts('h2o', spin='a', index=None, isosurf=0.0045)
Total running time of the script: ( 0 minutes 5.534 seconds)